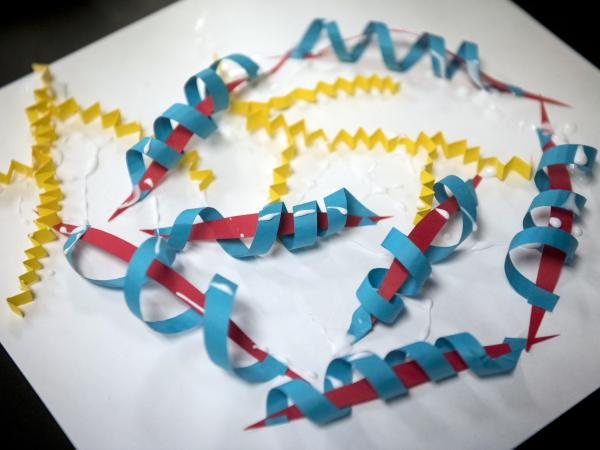
Students will explore 7th-grade science concepts by studying weather data and learning how to translate that data into a three-dimensional sculpture.
Different data sets include snowfall, river levels, fire data, etc. Students will assign a color and a shape or form to each different piece of data. They will then sculpt each type of data using paper sculpture techniques. When finished, students will have a sculpture that communicates their chosen weather data visually.
Objectives:
- Students will explore a variety of weather-related data sets
- Students will identify color, shape and form as elements of art
- Students will translate their chosen weather data into visual representations of color, shape and form
- Students will demonstrate a variety of paper sculpting techniques
- Students will write a three-to-four sentence statement about their artwork
Basic Lesson Outline:
- Introduce the Project and share slideshow
- Students will review and select their data set
- Students finalize their data translation plan on brainstorming worksheet
- Students are introduced to a variety of paper sculpting techniques and begin sculpting
- Students will be introduced to a variety of attachment techniques and continue sculpting
- Students display their work and artist statement, give feedback and discuss
Art Supplies:
- Pencils and erasers
- colored pencils
- paper in various colors
- grocery bags to hold sculpted pieces in between days
- scissors
- glue sticks
- heavy paper to mount sculpture (cardstock)
Other Resources:
- PowerPoint slideshow
- Brainstorming worksheet
Idaho State Learning Standards:
Arts and Humanities: Anchor Standard 2: Organize and develop artistic ideas and work
- VA:Cr2.1.7a: Demonstrate persistence in developing skills with various materials, methods, and approaches in creating works of art or design
- VA:Cr2.3.7a: Apply visual organizational strategies to design and produce a work of art, design, or media that clearly communicates information or ideas
Arts and Humanities: Anchor Standard 3: Refine and complete artistic work
- VA:Cr3.1.7a: Reflect on and explain important information about personal artwork in an artist statement or another format
Science Objective: Analyze and interpret data on natural hazards to forecast future catastrophic events and inform the development of technologies to mitigate their effects
Academic Language:
- Subject area language: data, data set, weather, observation, translation, variables
- Art Language: Sculpture, form, shape, color, 2D, 3D
Student Use of Vocabulary:
Students will use the words when creating their sculptures, when writing about their work, and when discussing their projects.
Student Grouping:
Students could work in pairs or independently.

0 comments
Leave a Comment